Role: Lead Designer, UX Researcher
Team: 1 Product Designer, 1 PM, 10 devs
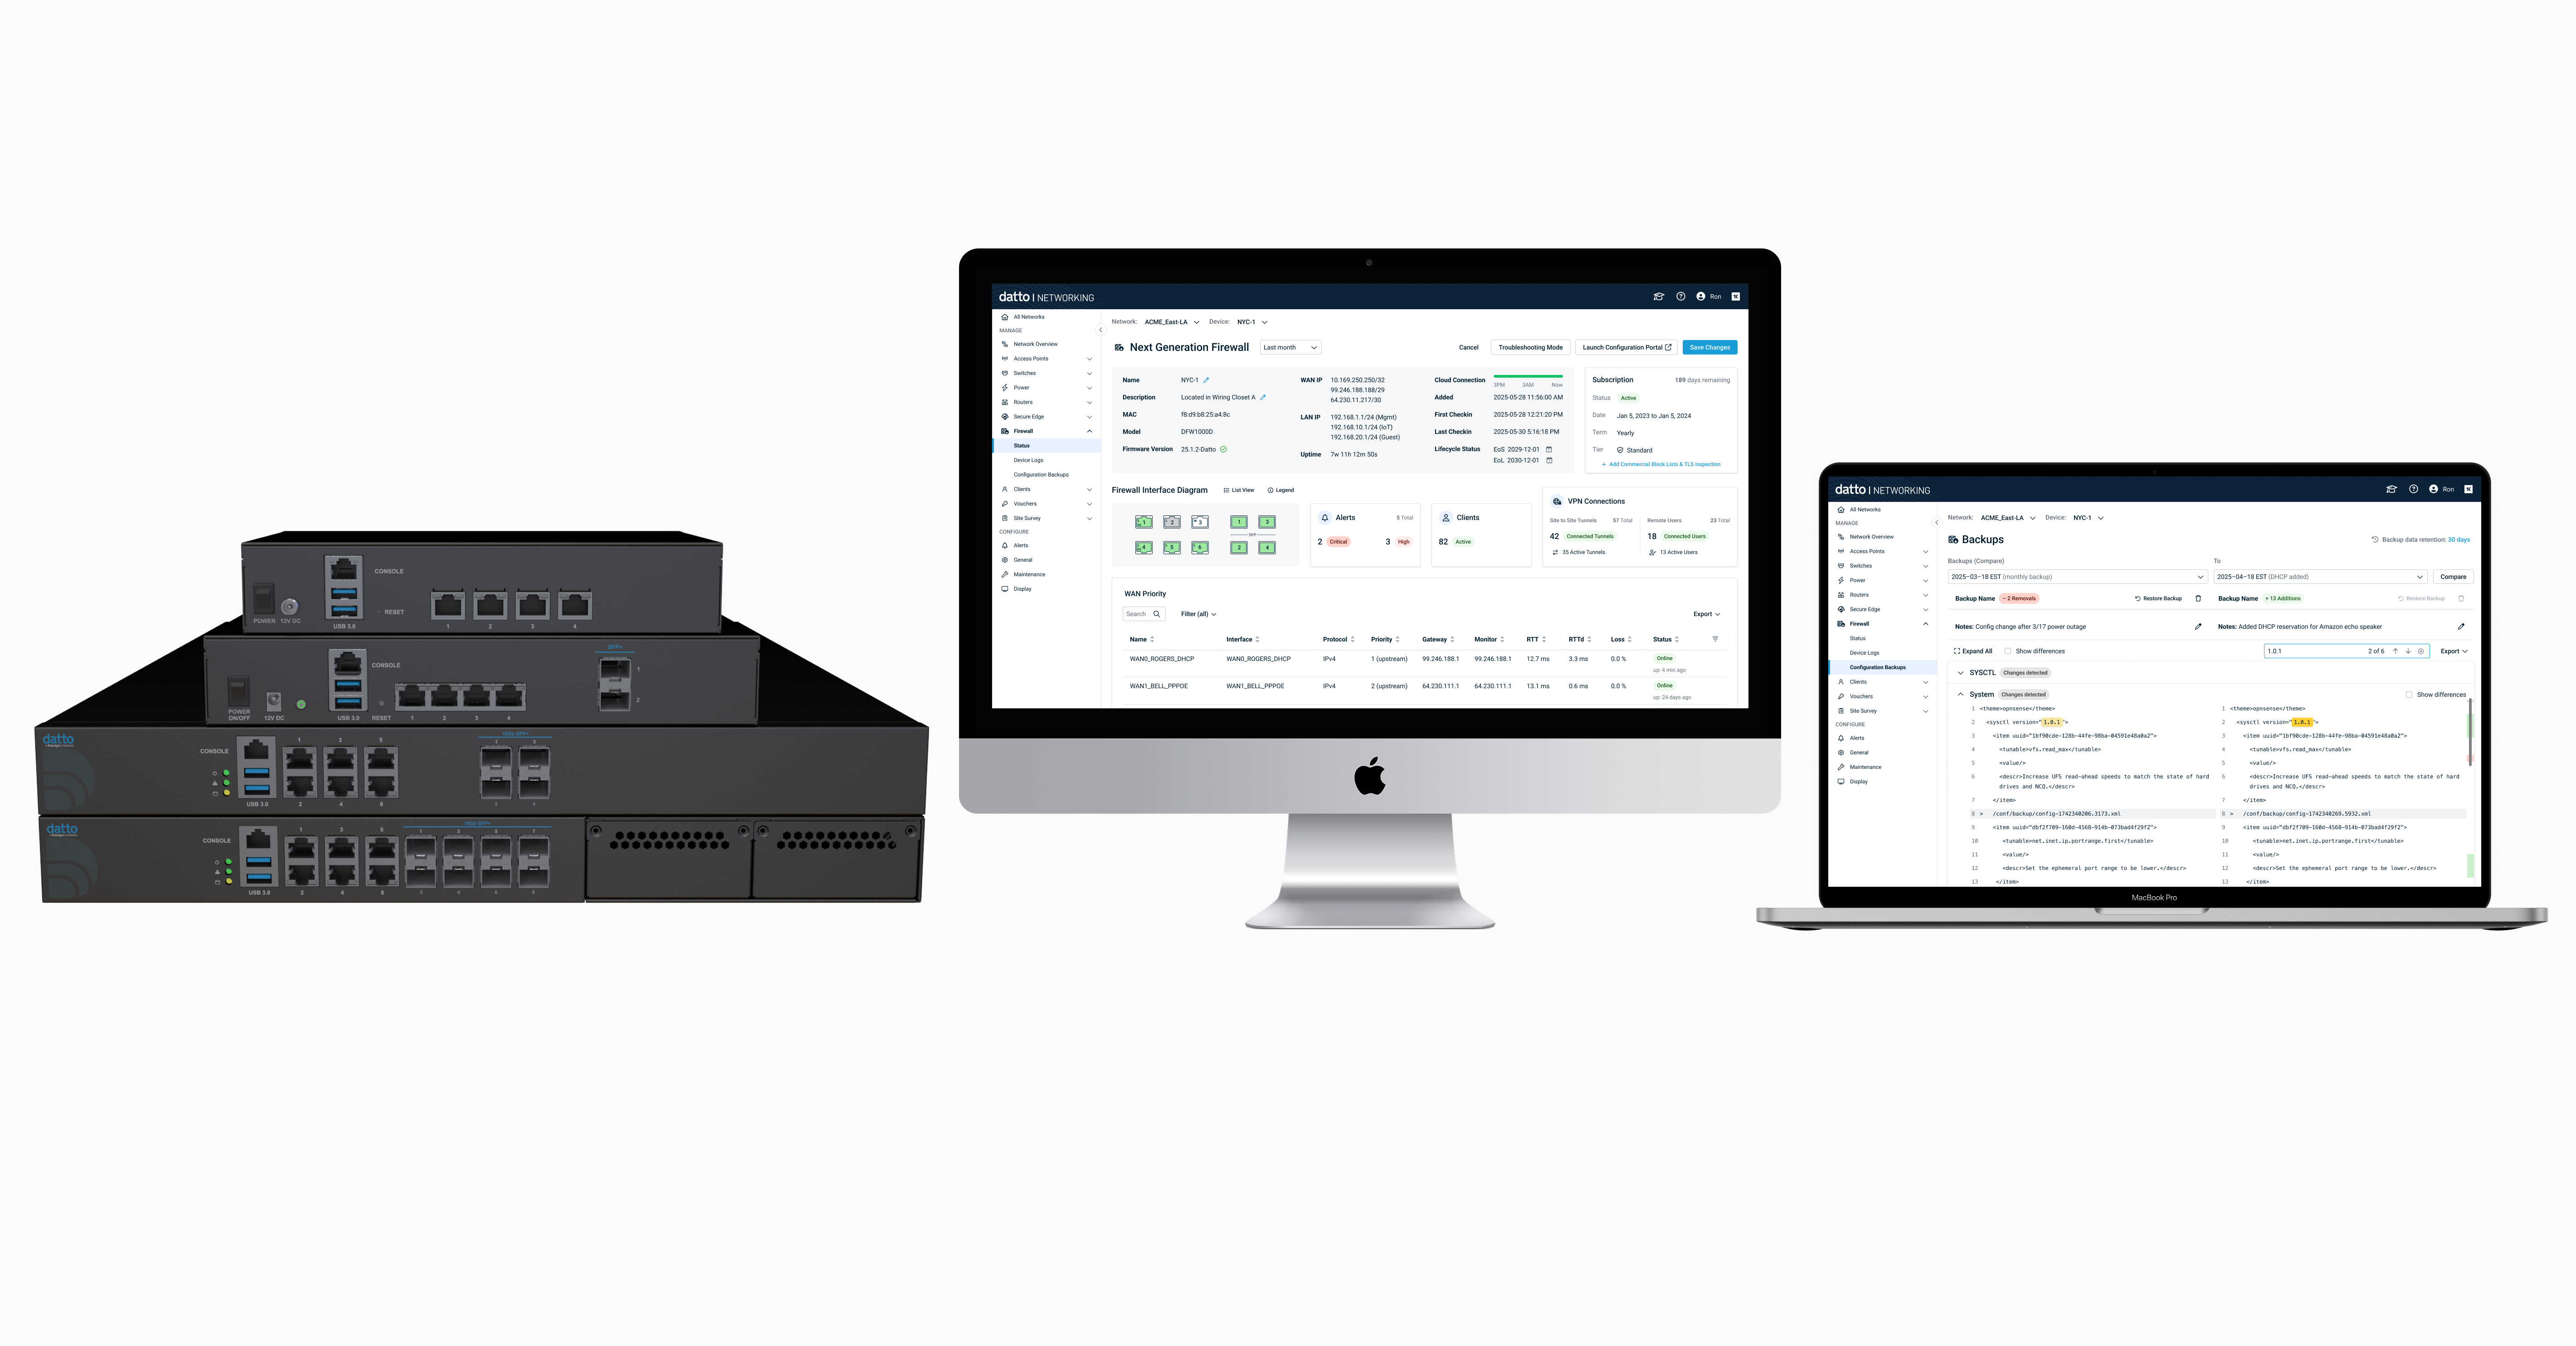
Imagine a network engineer at a Managed Service Provider (MSP) scrambling to troubleshoot a client’s network issue – they have Datto Network Manager open for the switches and Wi-Fi, but then need to log into a separate firewall portal, losing precious time. This fragmented tooling was a daily frustration for our partners, forcing them to juggle multiple interfaces in the midst of critical outages. We recognized that network operations lacked a “single pane of glass” for management, leading to slow response times and potential configuration errors. Addressing this pain point became a top priority for our team.
- Fragmented tooling: MSPs (customers) used Datto Network Manager to manage switches, access points, managed power, and secure edge while needing to use a third-party firewall in a separate portal.
- No single pane of glass for firewall signals: device health, alerts, logs, packet captures, configuration backups lived outside of Datto Network Manager, so technicians had to jump between systems and learn different tools.
- Time to market & scope constraints: Building a first‑party firewall UI end‑to‑end would be a large, multi‑quarter effort. We chose OPNsense, an open-source firewall platform, to cut development scope, leverage a mature feature set we didn’t yet have, and benefit from rapid firmware iteration—accepting short‑term limits on how deeply we can customize the local UI.
- 3rd-party config engine: OPNsense remains the source of truth for configuration; cadence of upstream releases informs our roadmap.
Given these challenges, we needed a plan that balanced user needs with technical and timeline constraints – this led us into a focused design process.
- Met monthly with 10 Advisory Board partners (targeted UXR) to confirm the need for a firewall in a single pane of glass.
- Audit of third-party firewall UIs and OPNsense capabilities, plus the constraints of rebuilding vs. leveraging.
- Build vs borrow: One of the toughest decisions was choosing to integrate a third-party firewall (OPNsense) rather than building from scratch. This was essentially a build vs. borrow decision dictated by our tight timeline. As the design lead, I worked closely with the PM and engineering to evaluate OPNsense’s capabilities. We determined that re-skinning its UI and integrating it would deliver a robust solution faster, at the cost of some short-term UI consistency trade-offs. This strategic choice became a cornerstone of our product approach.
- Scope and priorities: Leveraging insights from our advisory board partners, we identified and prioritized the critical day-one features needed for a successful launch. We mapped the full feature landscape and, given time constraints, ranked each by user value and technical feasibility. Core monitoring capabilities—including status dashboard, logs, backups, speed test, and configuration backup/restore—were designated for the MVP, while advanced functionality such as AI-assisted insights and alerting was deferred to later phases. This phased approach ensured we delivered immediate partner value without overextending scope.
- Partners consistently highlighted a set of features they considered essential for day-one use. From this feedback, we translated their priorities into tangible design concepts—producing mockups for critical workflows including device status, firewall interface diagram, speed test, device logs, packet captures, configuration backup, and a re-skinned OPNSense UI for better usability. We also explored supporting features such as application control, alert settings, and AI-assisted insights to ensure partners could both monitor and act within the firewall environment effectively.
- Conducted usability testing with advisory board partners using prototypes to validate workflows and interaction patterns. Testing confirmed the need for an integrated firewall (“We need everything in one place”) and exposed usability gaps—such as unclear logs filtering, low-visibility port diagram icons, and insufficient contextual information. These insights informed iterative design improvements across multiple flows.
- Spec package: redlines, interaction notes, error and empty states, analytics and logging.
- Dev reviews and QA support (in progress)
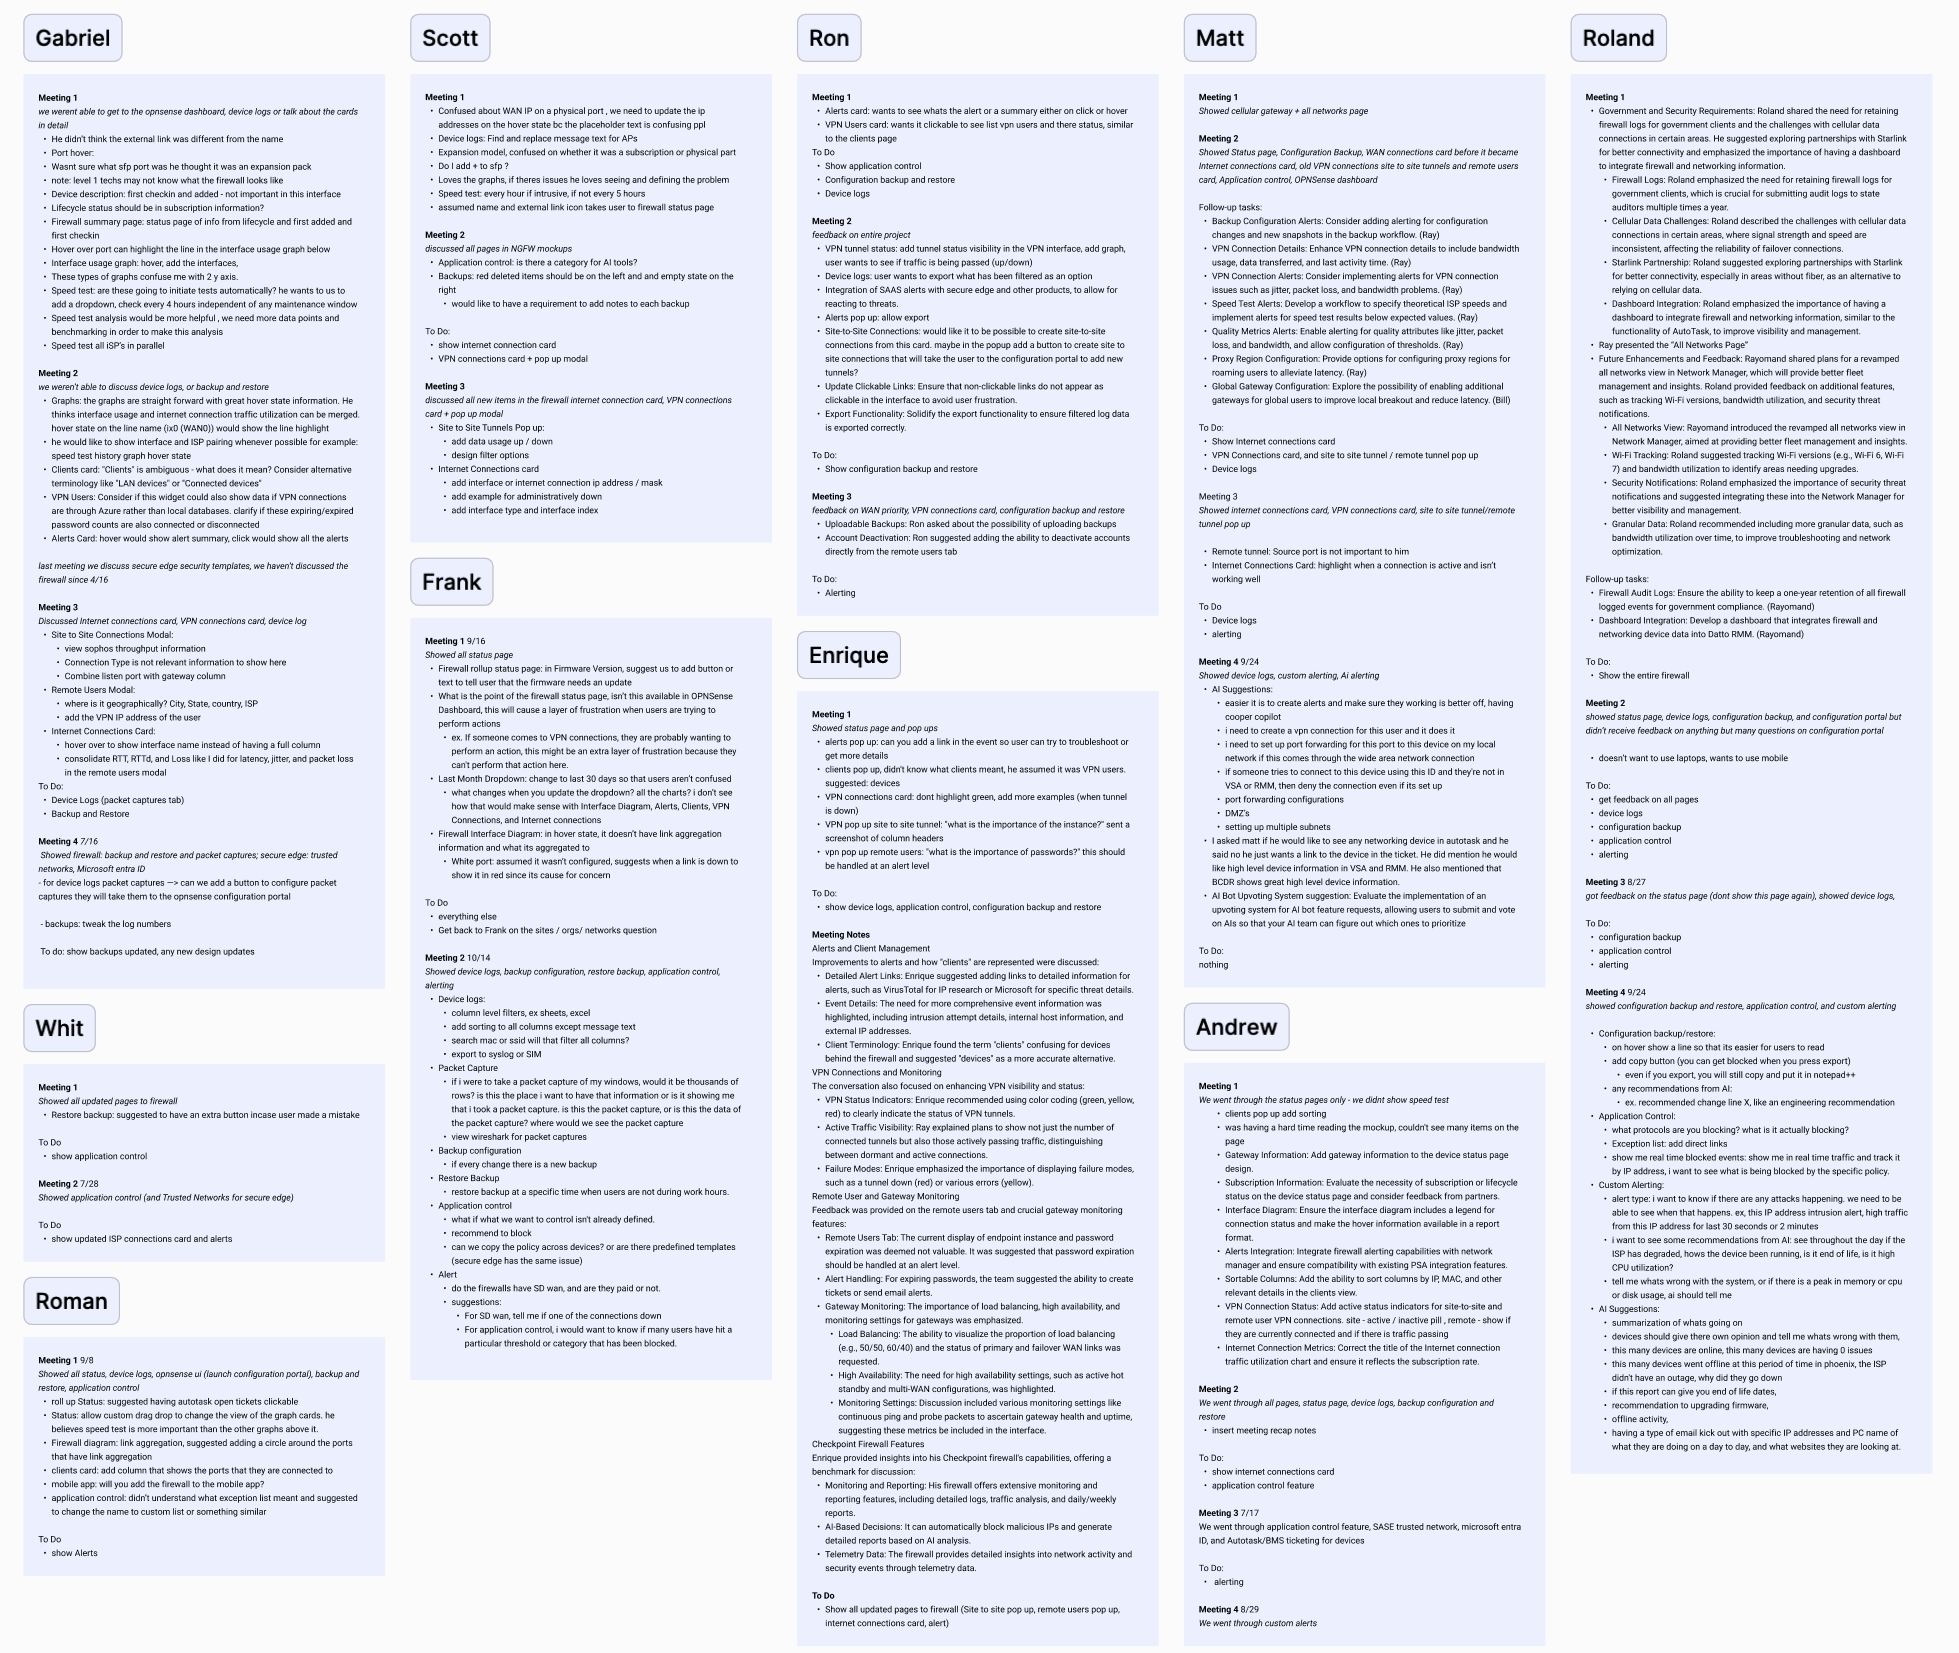
UXR Session feedback with advisory board partners
1. Status Dashboard
- Device & subscription summary (model, license, firmware).
- Interface diagram with per‑port status (up/down, speed, duplex, PoE if present).
- Insight cards: Alerts, Clients, VPN connections → each opens a detail modal.
- ISP connection card (WAN, IP, uptime, gateway reachability).
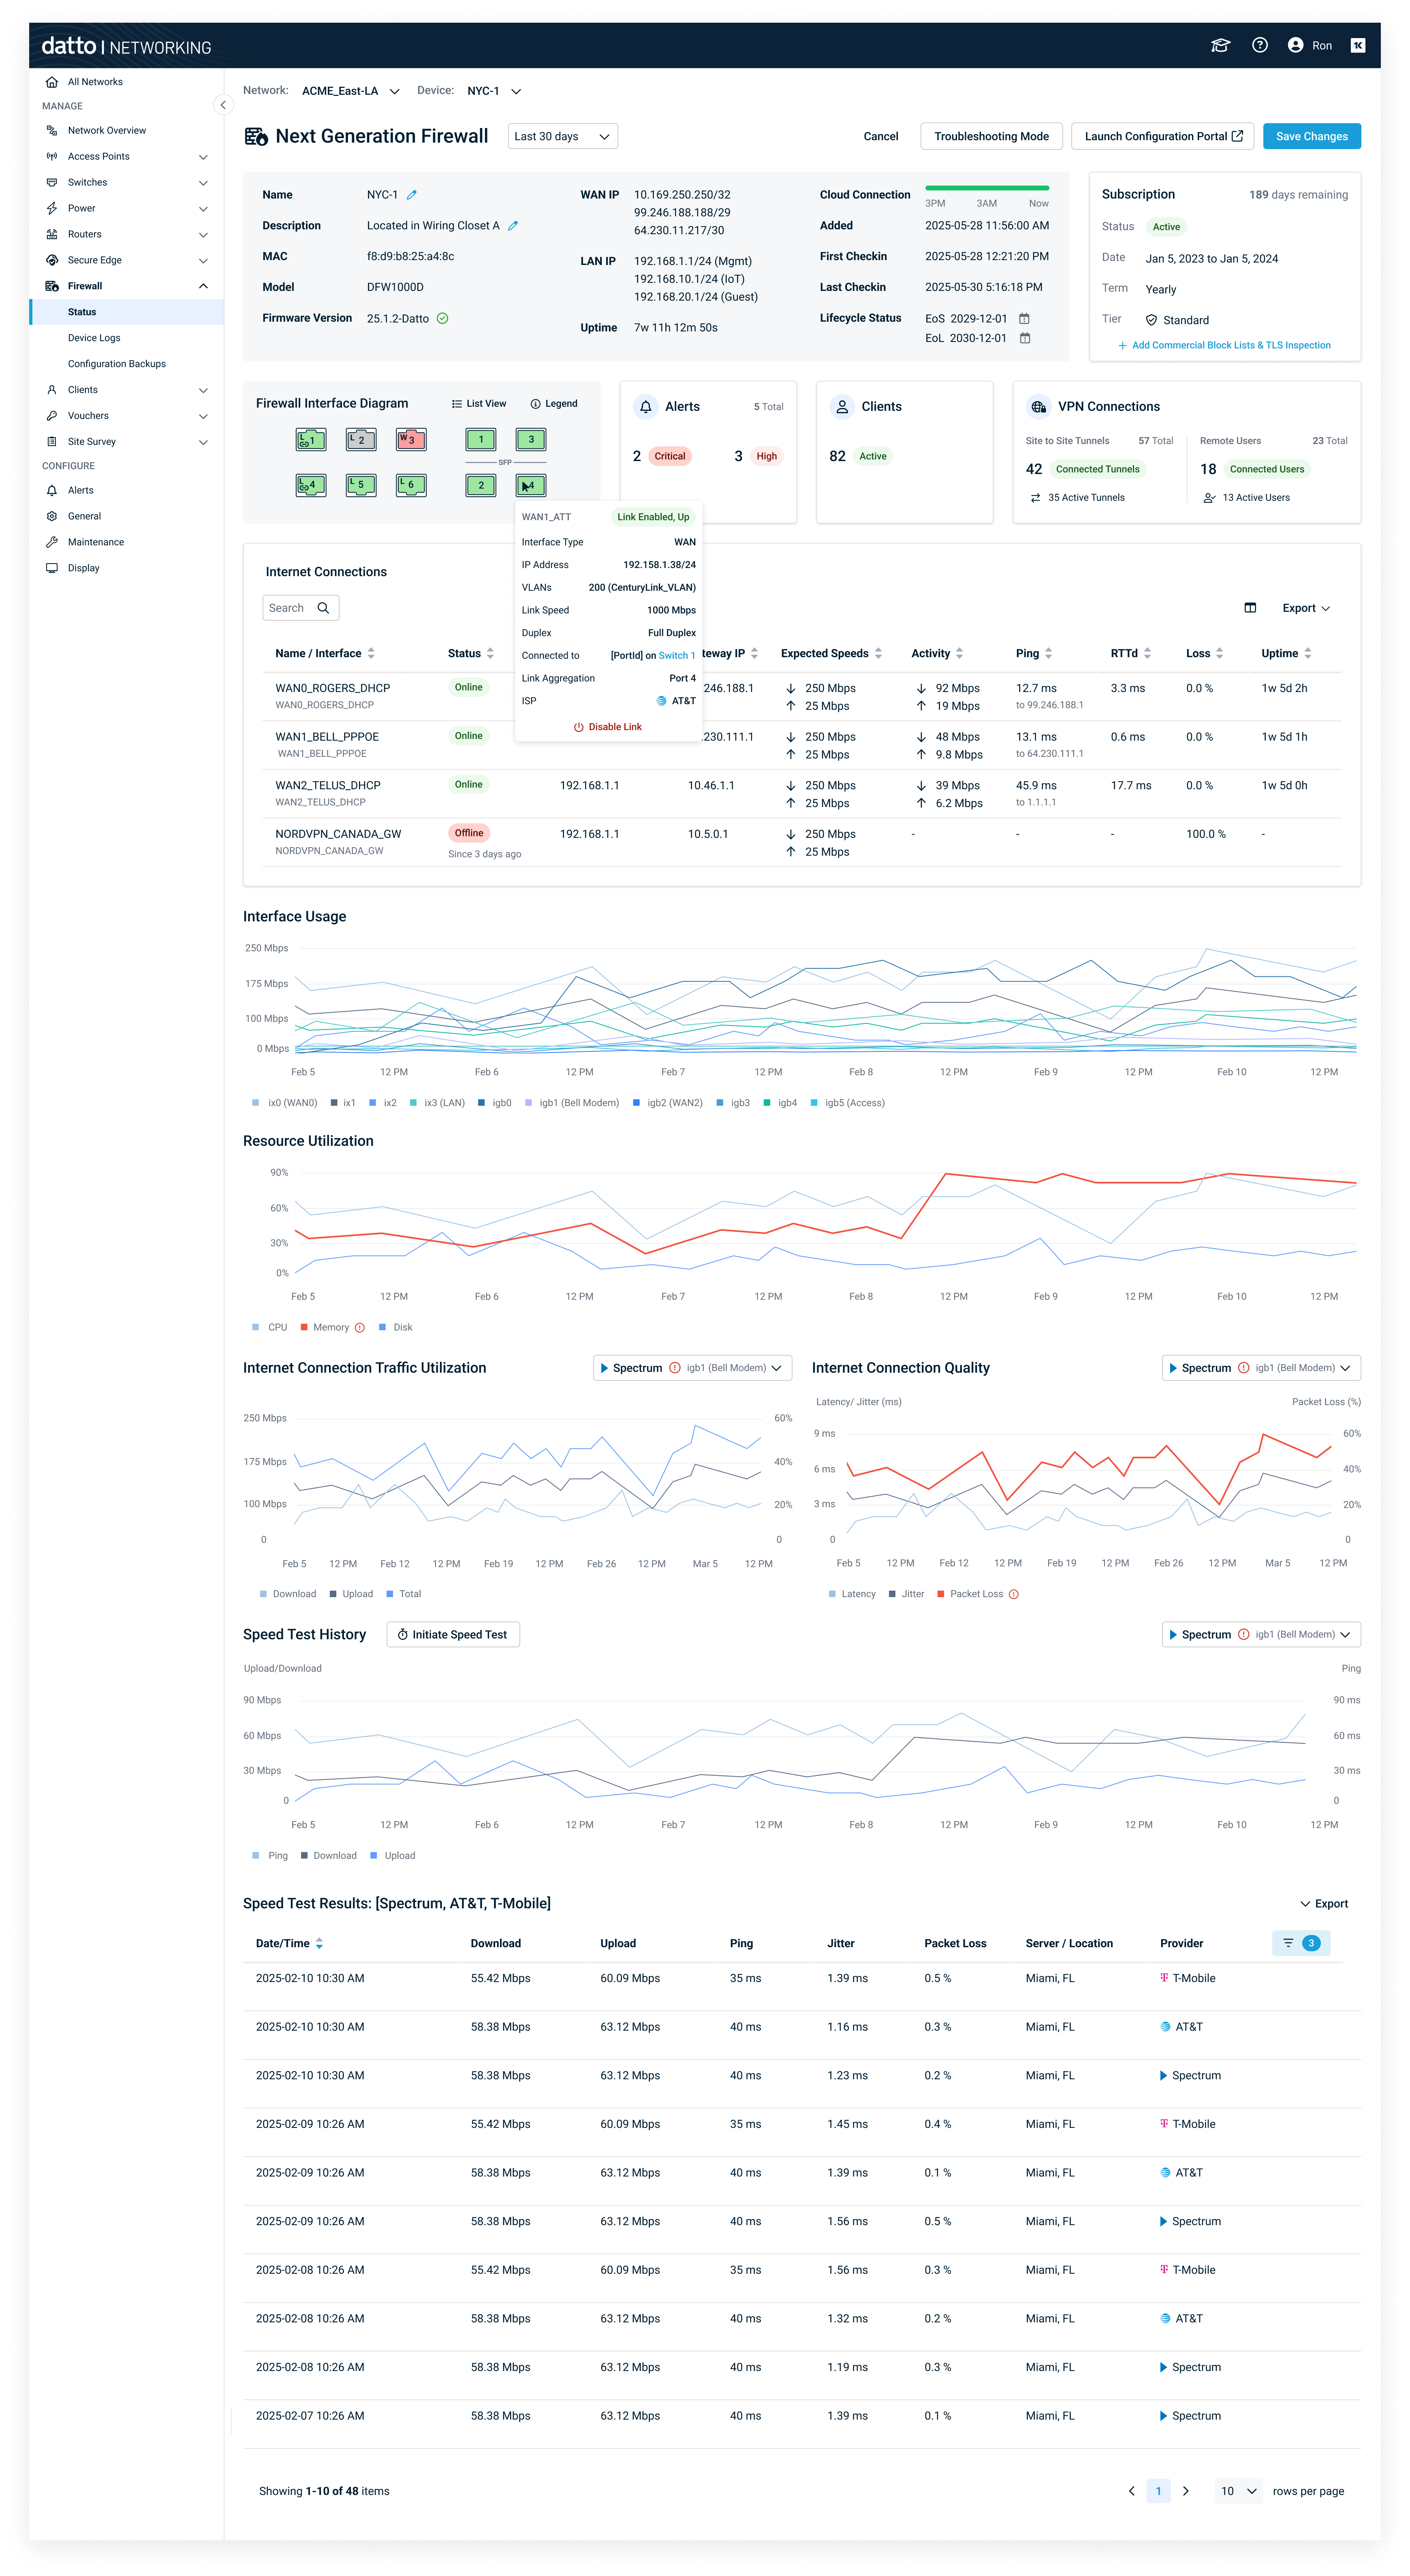
Interface diagram, insight cards, and multi‑metric charts.; consistent card patterns with other Datto Network Device pages.
2. Device Logs & Packet Capture
- Unified table with filters (time range, severity, interface, keyword).
- Packet capture: start/stop controls, interface selection, ring buffer; export pcap.
- Actionable empty states guiding Level 1 techs.
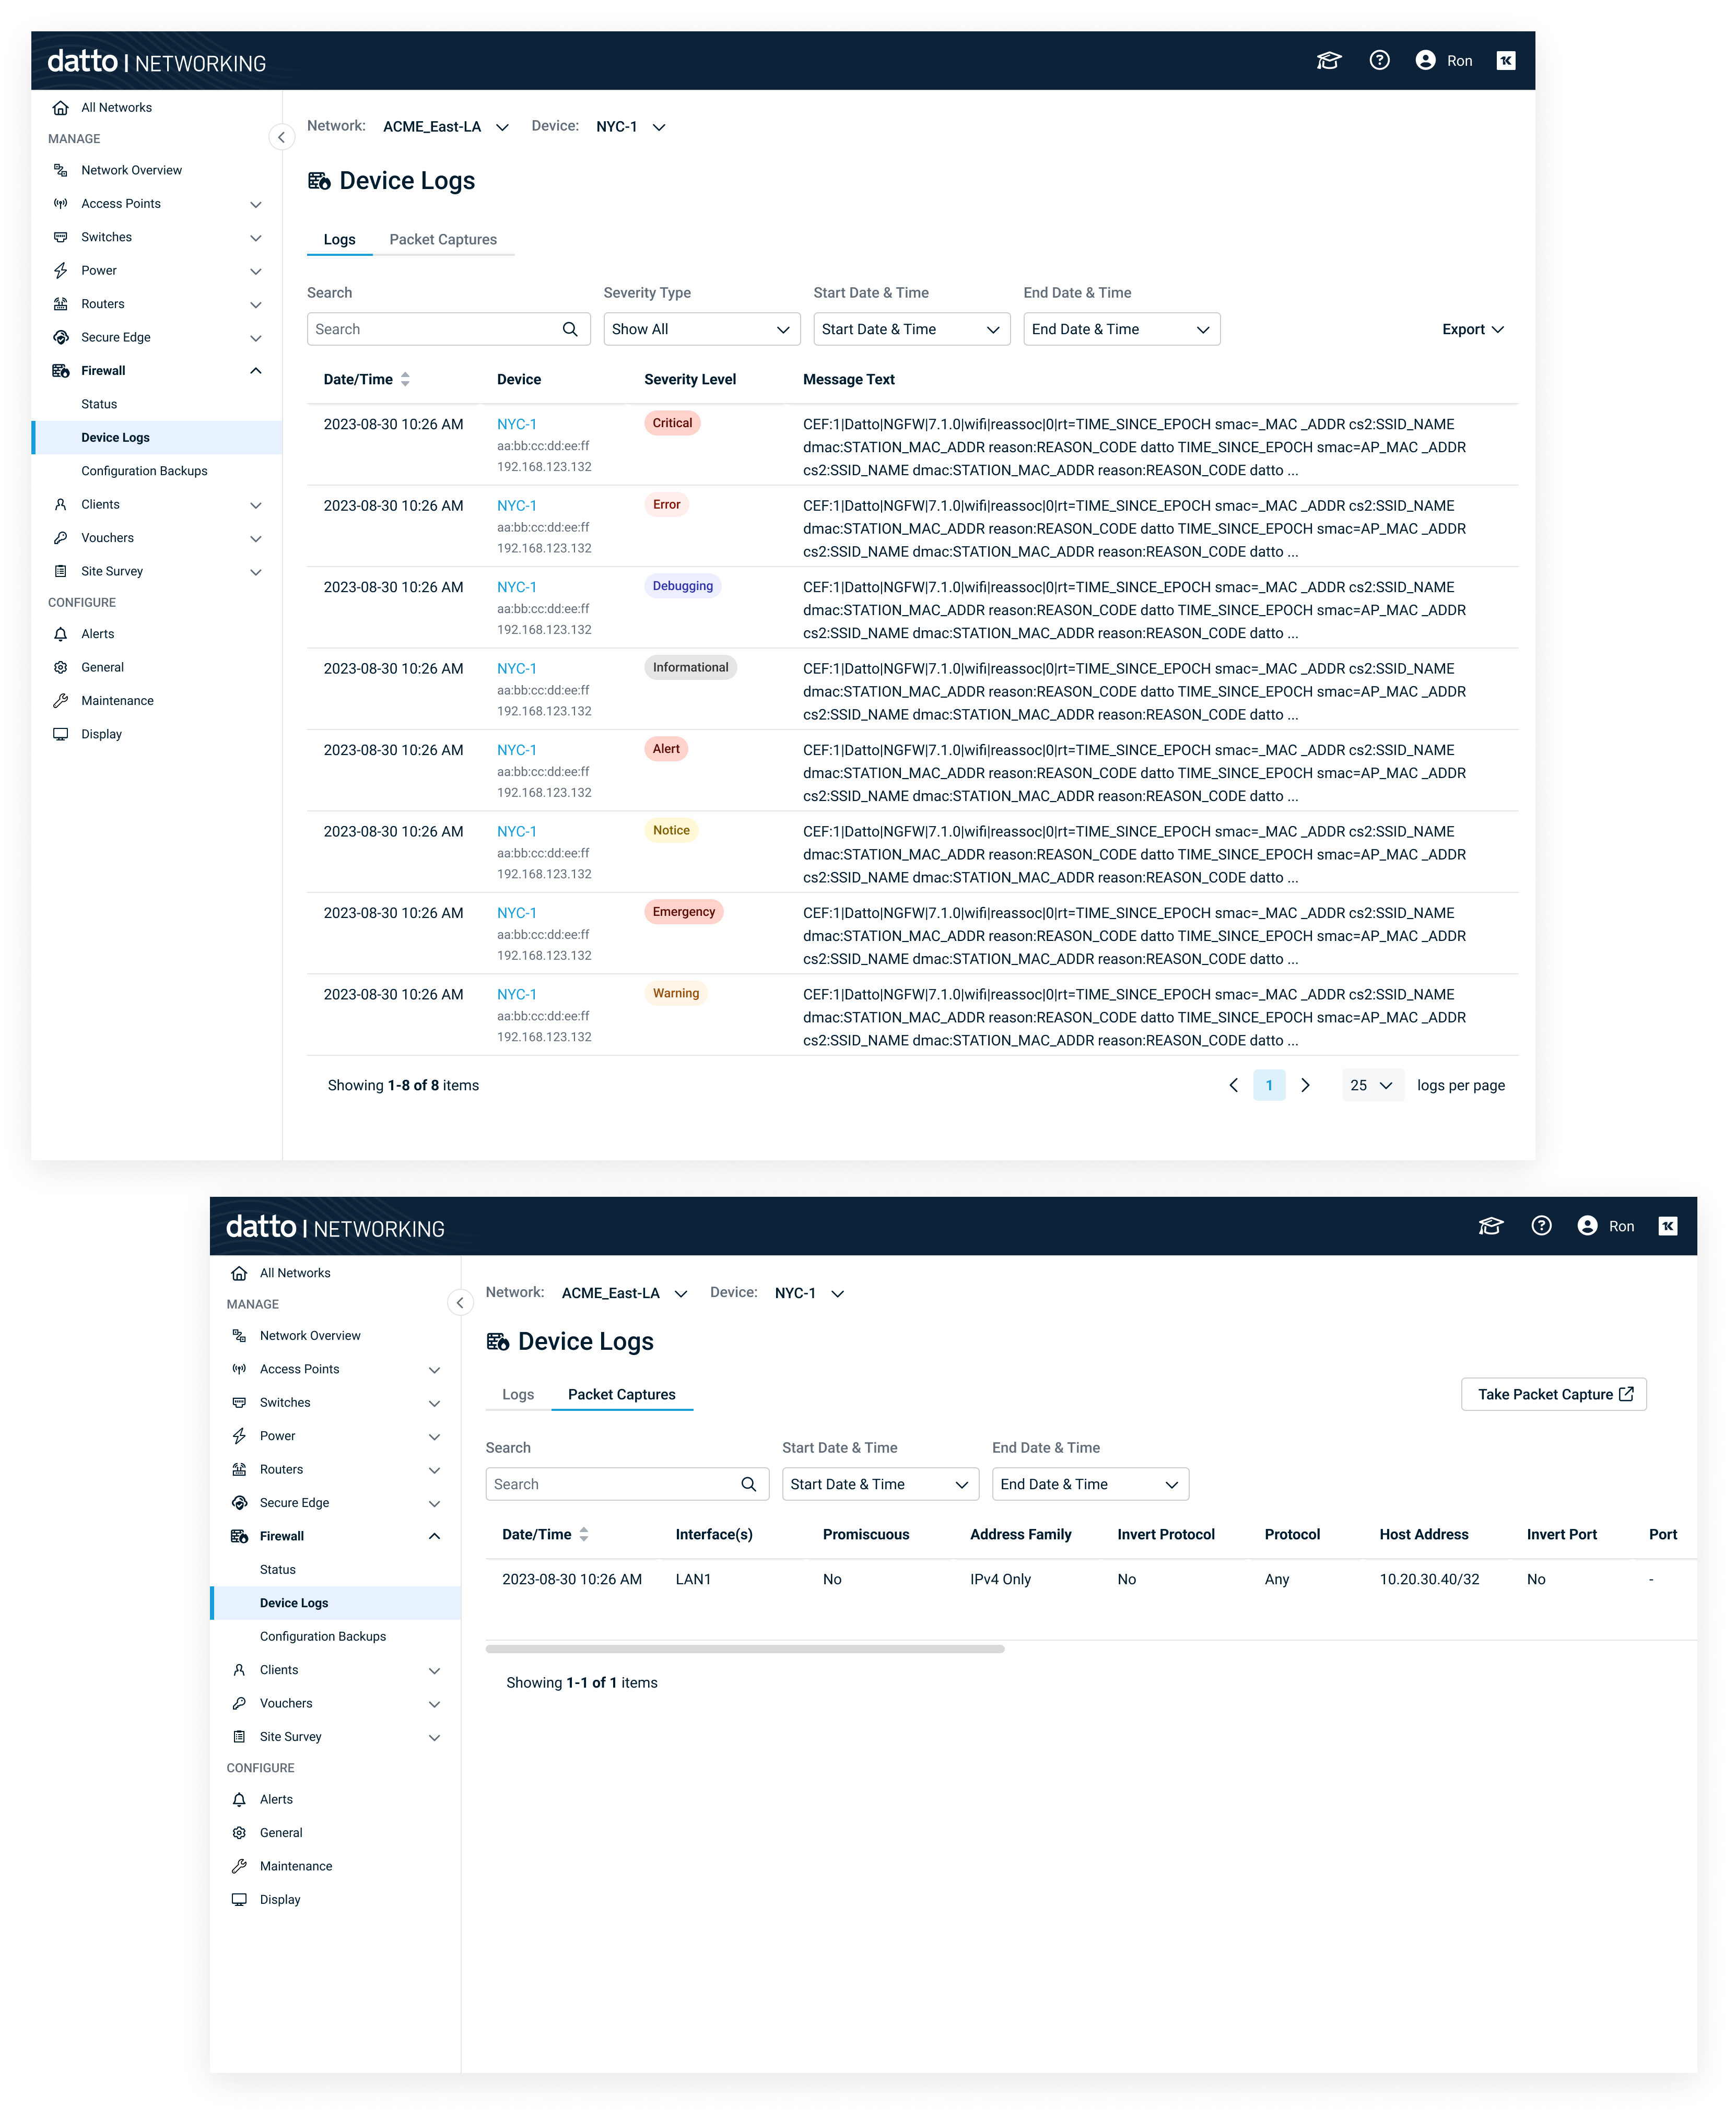
Filterable logs, on‑demand capture, quick export for escalation.
3. Configuration Backups & Restore
- Backups list: timestamp, notes.
- Compare view with color‑coded differences: Added = green, Deleted = red, Modified = grey.
- Scrollbar change markers highlight where differences occur in the document, so users can jump directly to change-heavy sections.
- Show differences checkbox to focus on changes.
- Actions: restore, delete, download.
- Outcome: Safer rollbacks; faster root cause analysis during incidents.
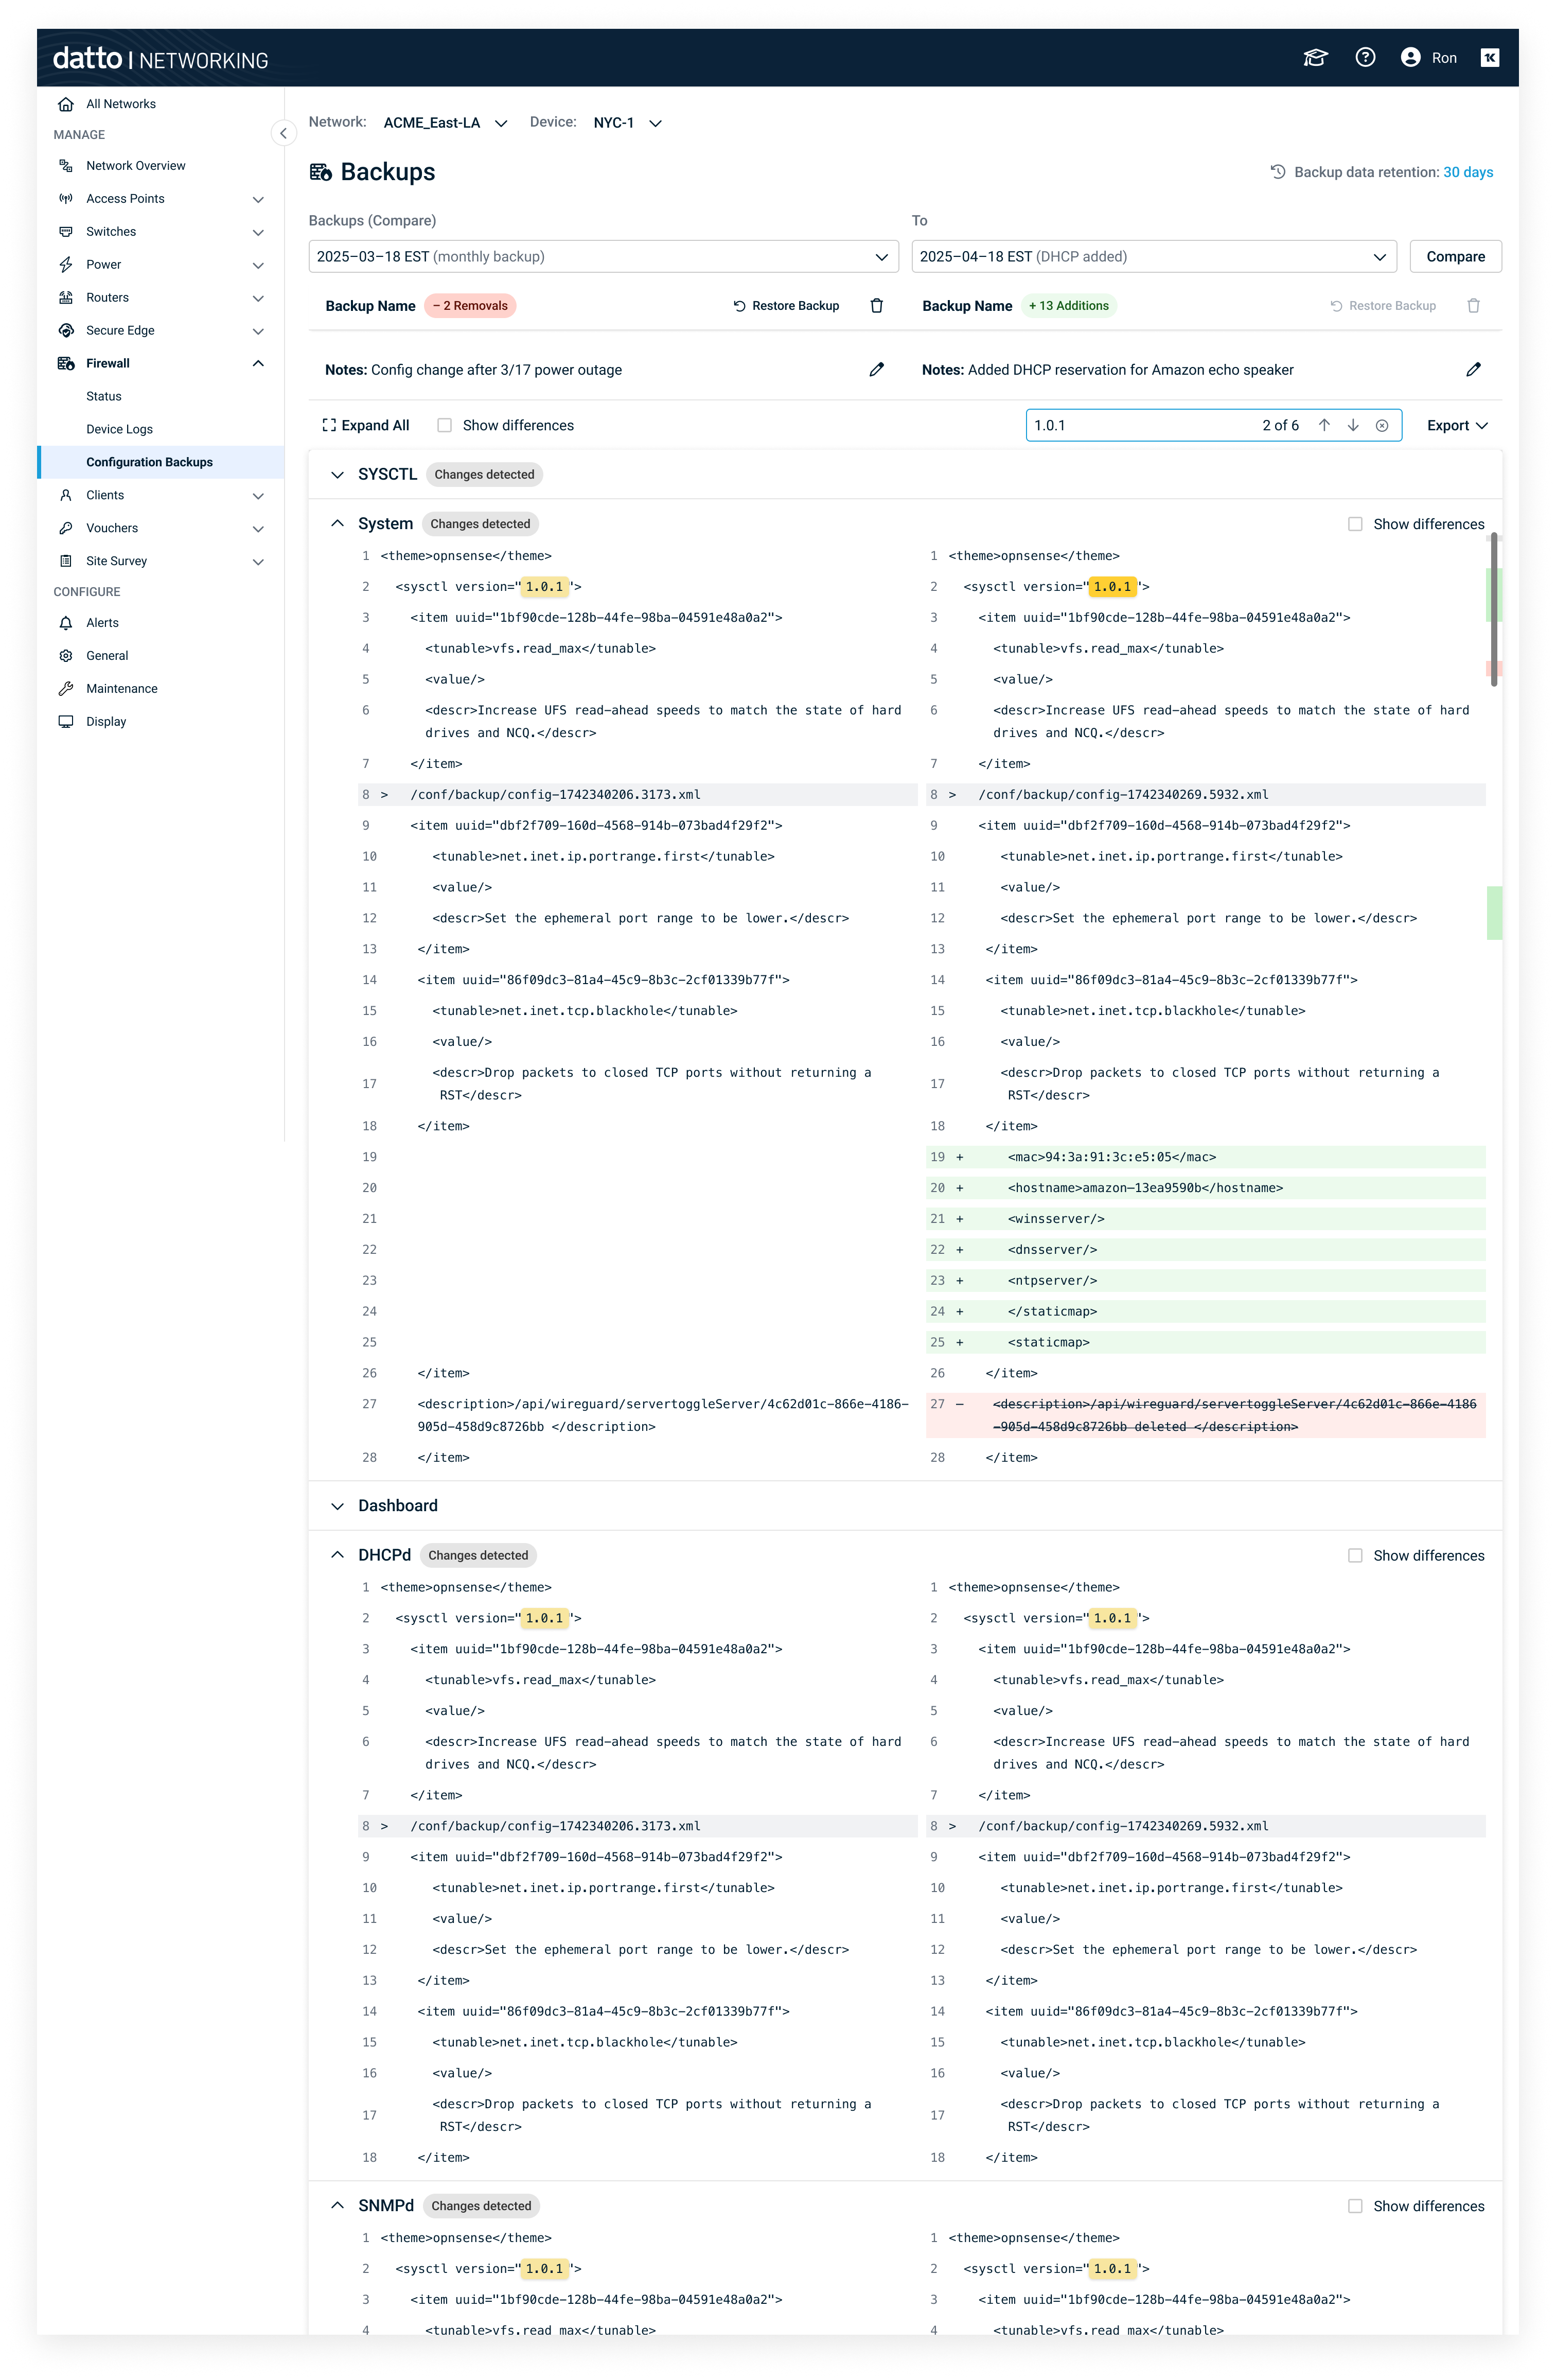
Color‑coded diff with focus toggle and restore action.
4. Application Control (in Local UI)
- Policy builder to permit/deny applications or app groups.
- Congestion‑aware prioritization to elevate critical apps during contention.
- Preview & impact indicators before publish.
- Value: Balances productivity and bandwidth; aligns with MSP service-level agreements.
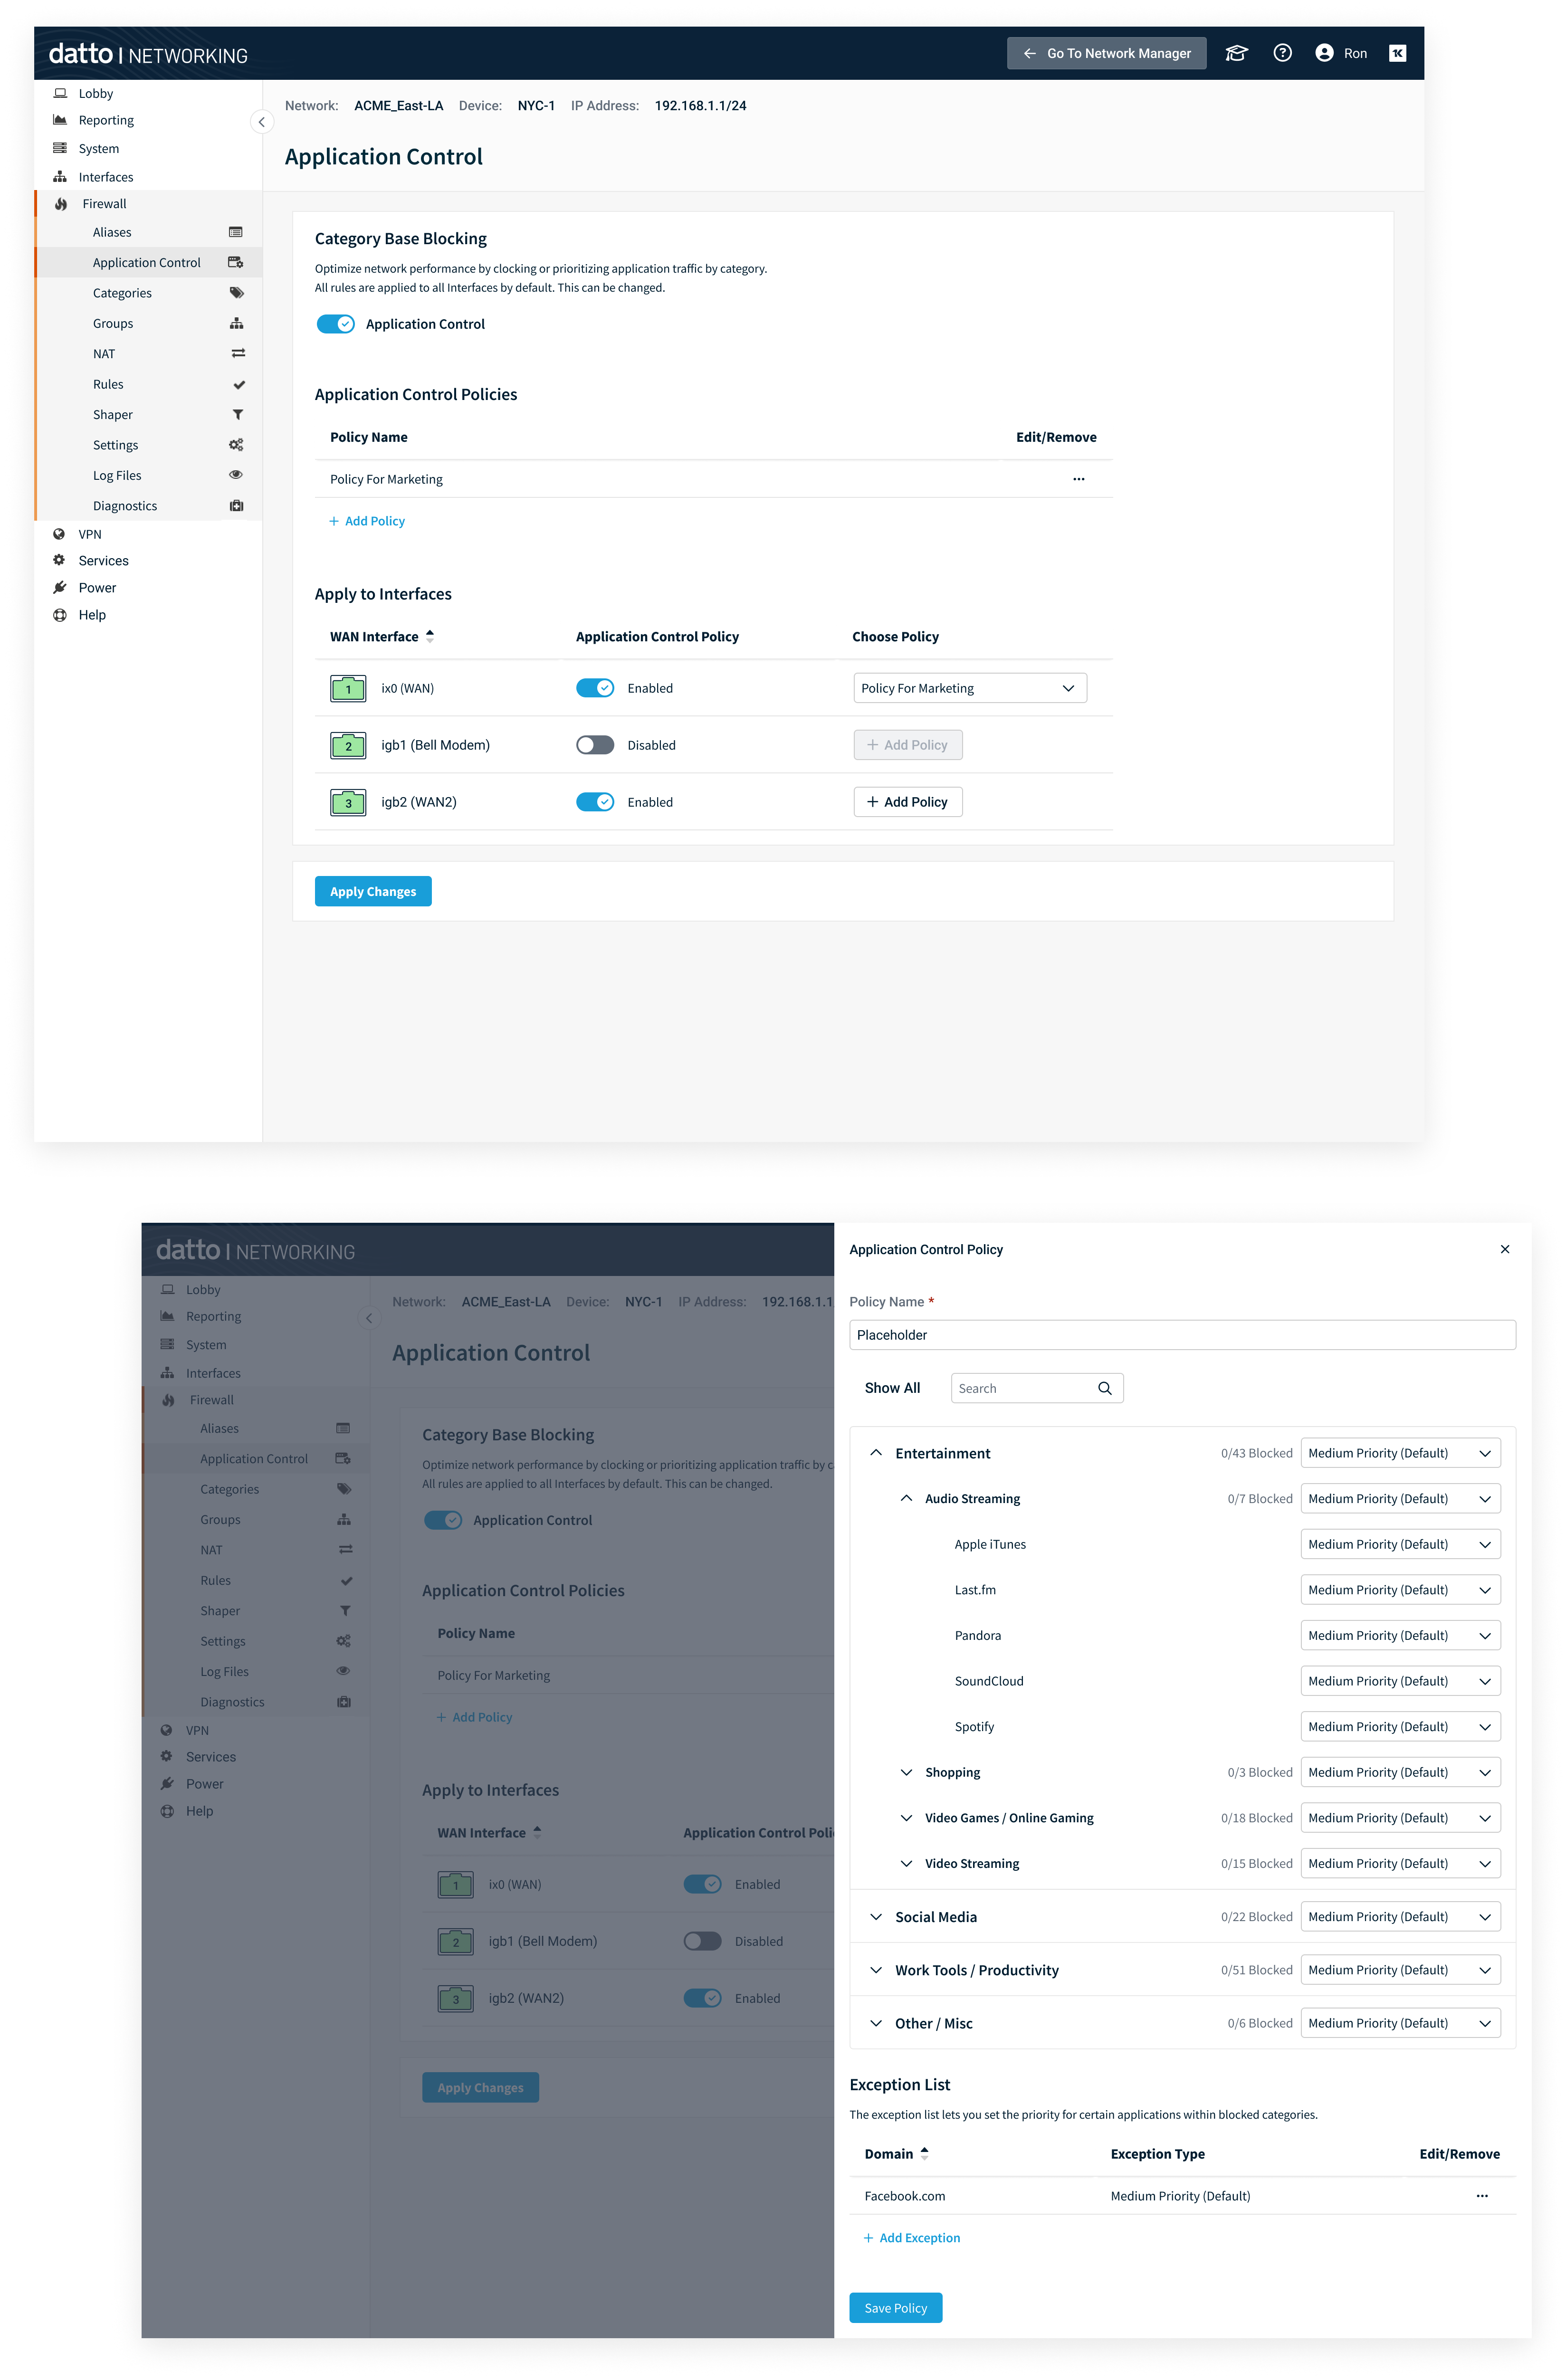
App policy builder with prioritization during congestion.
5. Alerts - Network & Custom (with AI)
- Predefined events (e.g., Cloud connection failed).
- Destinations: Email, Autotask, BMS.
- Custom alerts: boolean expressions with thresholds & durations, e.g.: - IF CPU > 80% AND Memory > 90% for 5 min; notify user.
- AI‑assisted creation: users describe the alert; assistant generates the rule, validates, and previews.
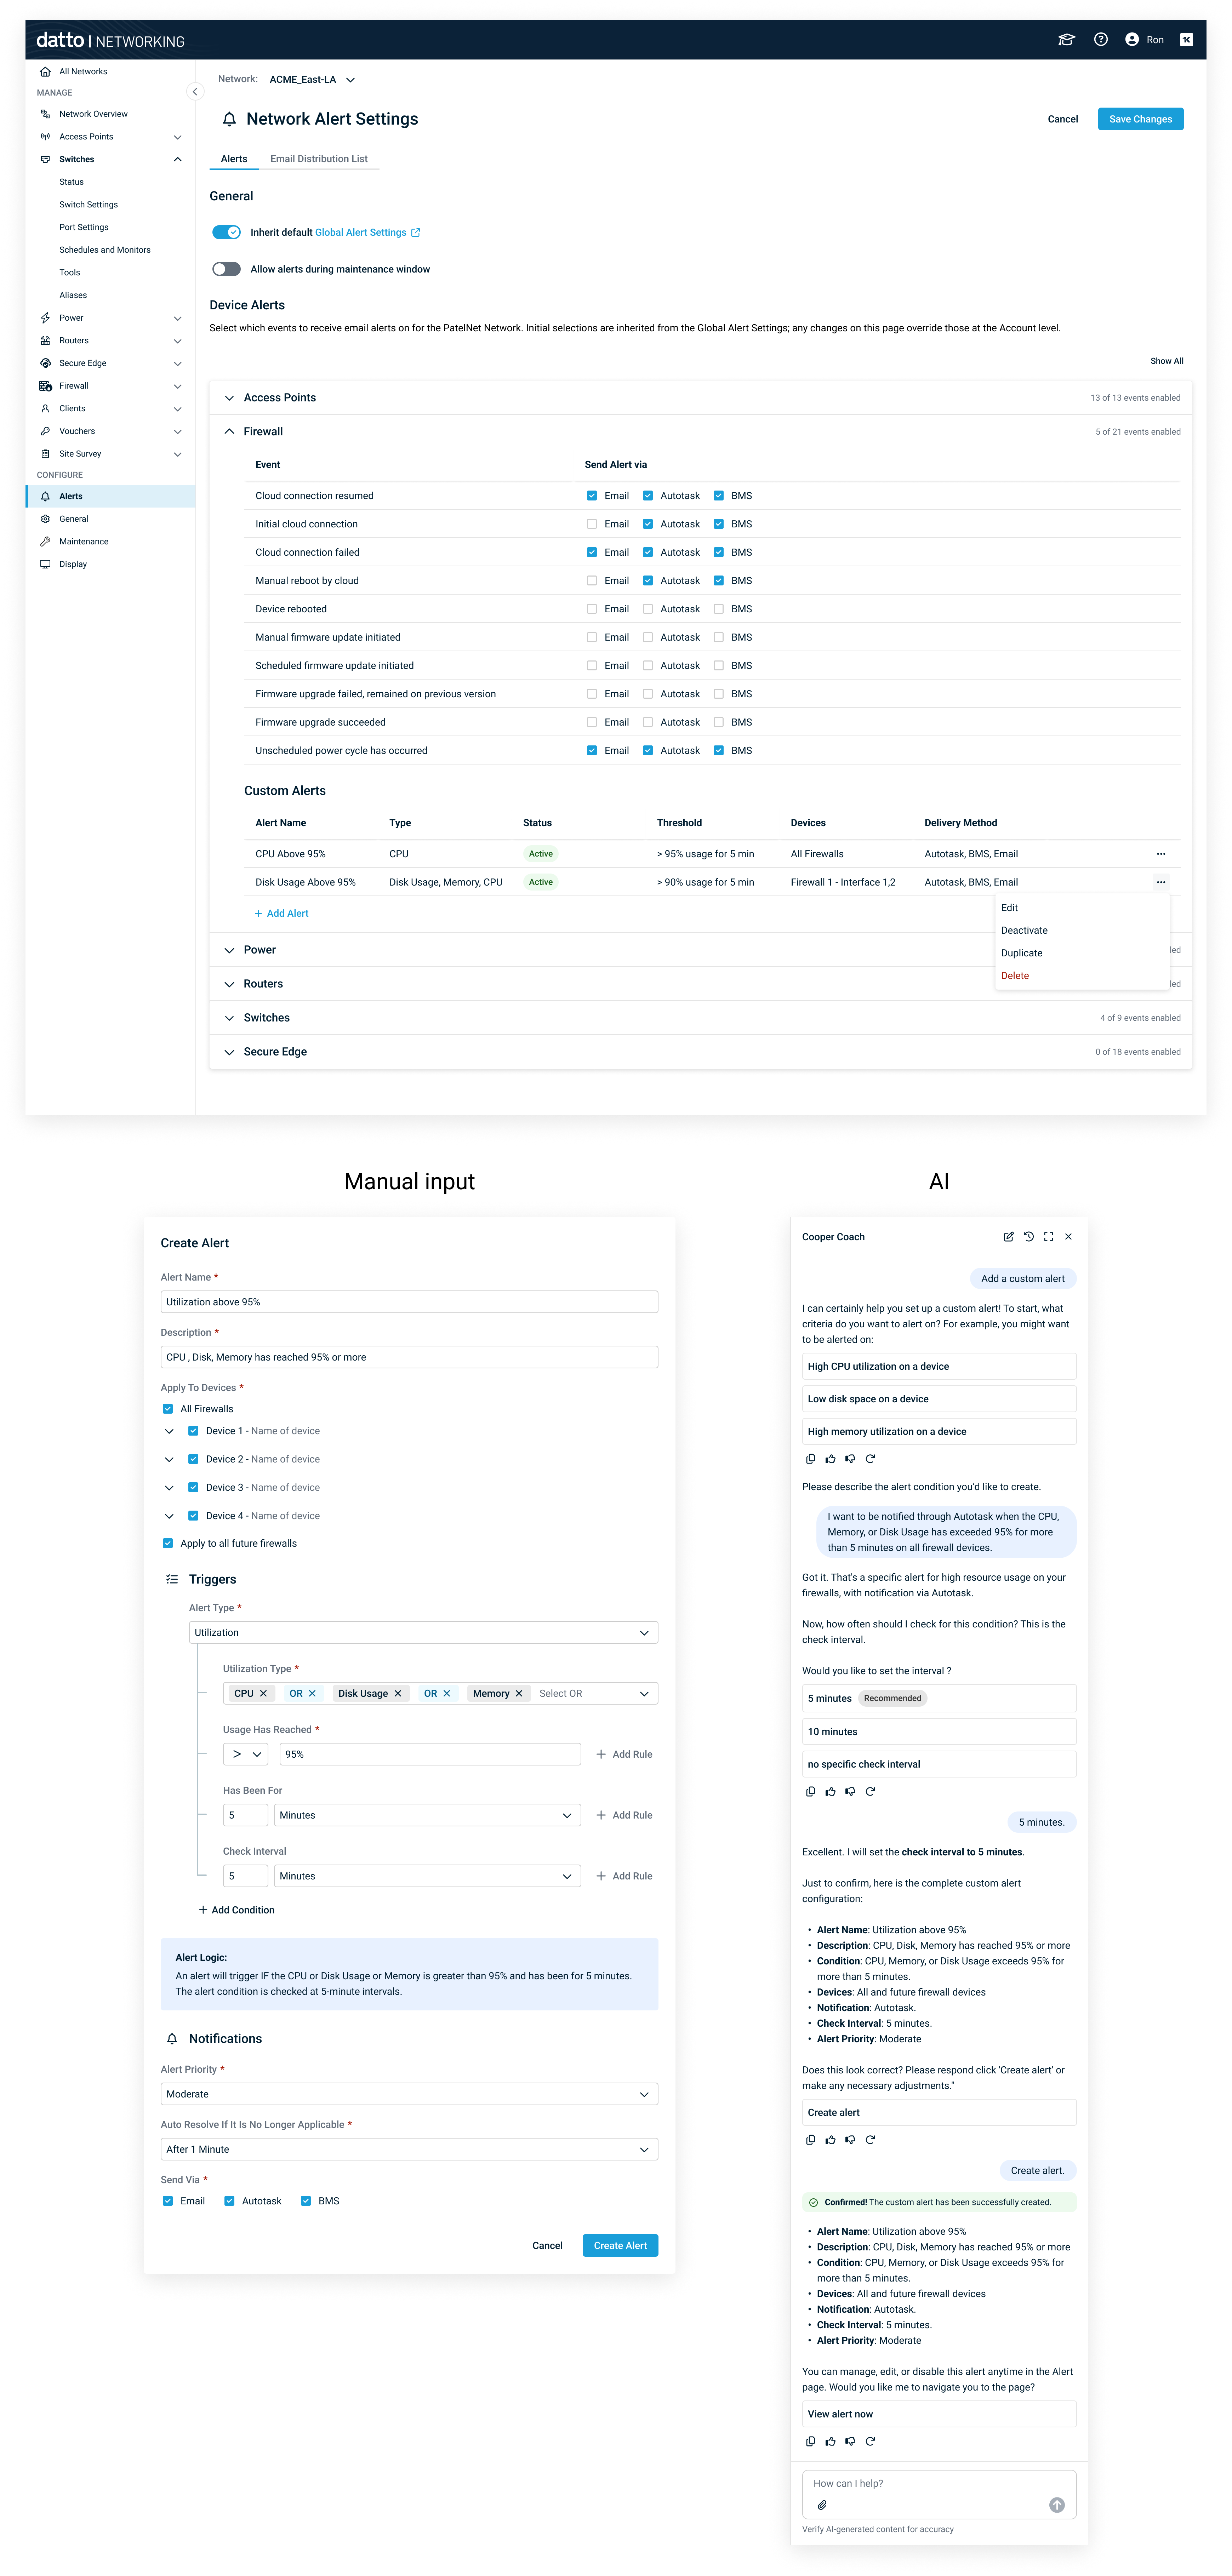
Rule builder + natural‑language prompt to generate alert logic.
This project represented more than just a new feature — it was the foundation of a new product experience for Kaseya. Through close collaboration with partners, product management, and engineering, I was able to translate complex networking concepts into a design that feels approachable, efficient, and scalable.